Available for opportunities

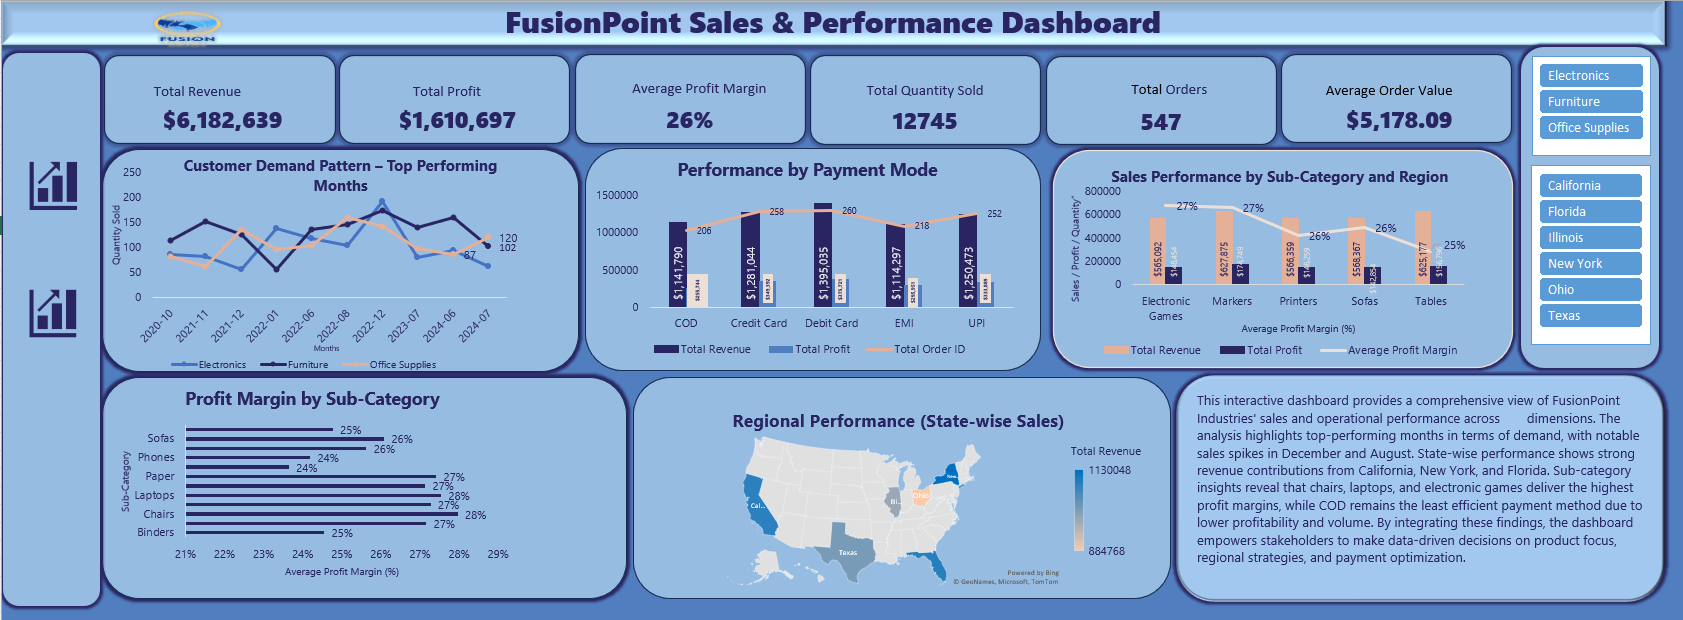
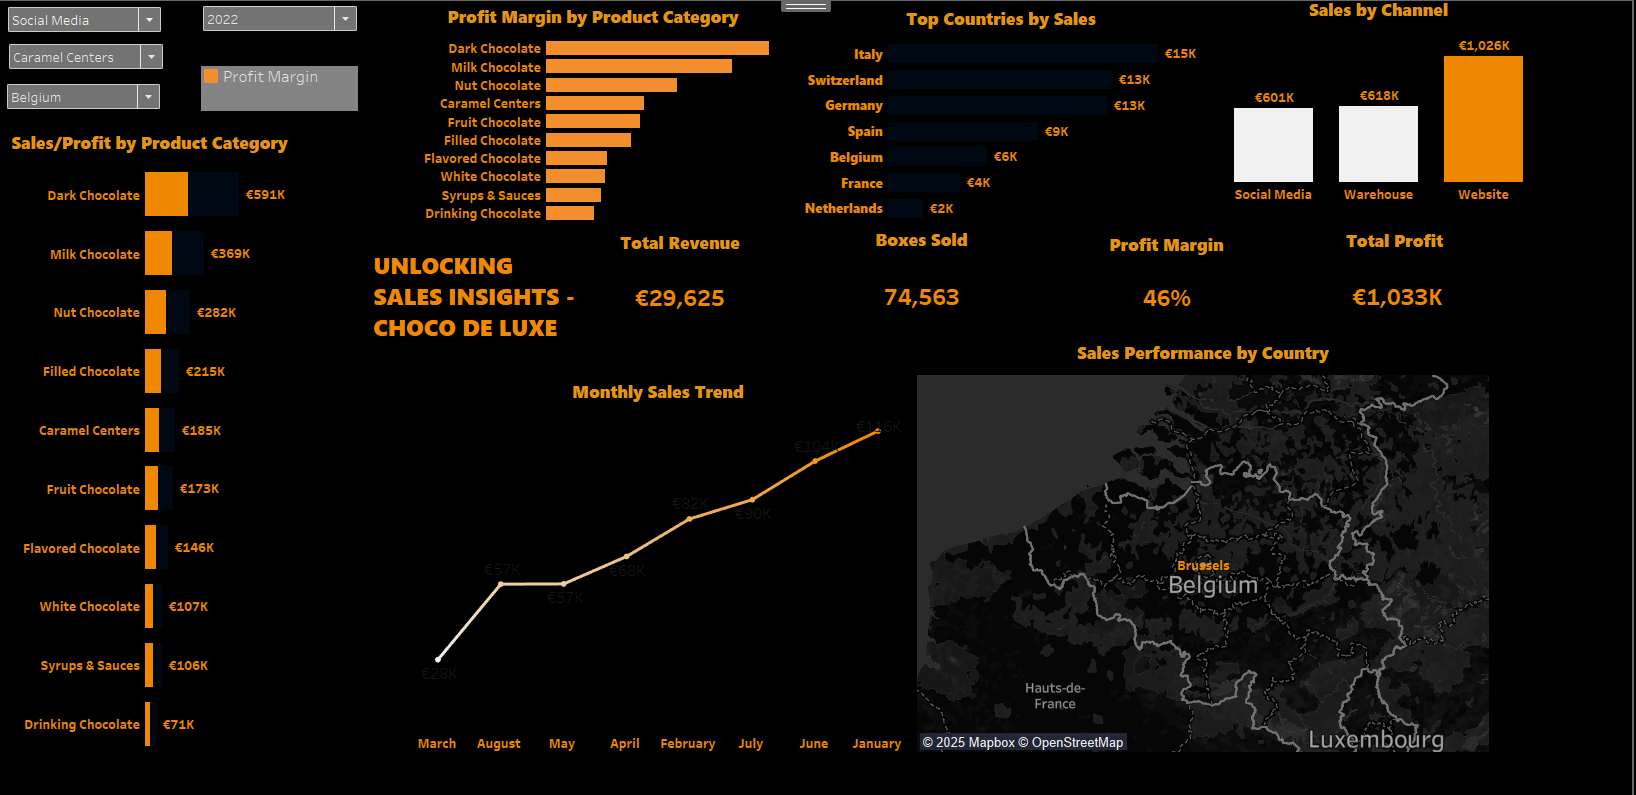
Data Analyst & Business Intelligence Specialist

Turning data into strategic insights that drive better business decisions across sales, operations, and customer performance.

10+
Projects
5+
Industries
100%
Business Impact
ADEOLA FATOKI OMOWUNMI - Data Professional
Power BI
SQL
Excel

About Me

Analytical and detail-oriented professional with extensive experience in data analytics, business intelligence, and market research. Proficient in SQL, Python, Tableau, and Power BI, leveraging data-driven insights to optimise business processes, enhance decision-making, and improve operational efficiency. Skilled in designing interactive dashboards, automating reporting processes, and conducting trend analysis to drive strategic growth. Adept at managing large-scale research projects, implementing survey methodologies, and transforming complex data into actionable insights. Collaborative team player with a strong track record of working cross-functionally to support data-backed business strategies, increase profitability, and drive informed decision-making.

Business Intelligence

Designing interactive Power BI dashboards and automating reporting processes to provide real-time visibility into KPIs and business performance metrics.

Data Analysis & Research

Managing large-scale research projects and implementing survey methodologies using SQL and Python to uncover trends and drive strategic decision-making.

Strategic Growth

Conducting trend analysis and working cross-functionally to transform complex data into actionable insights that increase profitability and operational efficiency.

Featured Projects

Real-world business intelligence solutions driving strategic decisions

Fusionpoint Industries Sales Analysis

Sales Performance & Profitability Analysis for FusionPoint Industries

2024

FusionPoint Industries is a U.S.-based omnichannel consumer electronics retailer offering products ranging from electronic games to office equipment such as printers. Despite strong overall sales performance, leadership lacked visibility into what truly drove profitability, which regions and products performed best, and how payment behavior affected revenue outcomes. This limited their ability to optimize pricing, inventory, and marketing strategies.

Power BI PostgreSQL SQL Excel
Learn More
Employee Success Analytics

Employee Success Analytics — Workforce & Retention Insights (NextGen Corp)

2024

NextGen Corp is a growing technology company focused on building high-performing teams while maintaining strong employee satisfaction and retention. Leadership wanted data-driven insights into workforce performance, turnover patterns, and compensation fairness to support strategic HR decisions.

PostgreSQL SQL Excel KPI Reporting
Learn More
Techtronix Innovations Dashboard

Techtronix Innovations Analytics - Sales, Customer & Profitability Performance

2024

Techtronix Innovations is a global leader in the microchip and robotics industry. The company faced challenges with sales unpredictability, inventory inefficiencies, and identifying profitable markets, limiting its ability to scale operations and optimise production planning. Leadership needed a data-driven performance view to support strategic growth and operational efficiency.

Power BI Excel Business Intelligence KPI Reporting
Learn More
Choco de Luxe Performance Analytics

Choco de Luxe European Sales Performance & Market Expansion Analysis

2024

Choco de Luxe is a premium artisanal chocolate brand headquartered in Brussels, Belgium, operating across several European cities through retail outlets, online platforms, and supermarket channels. Despite strong brand recognition, leadership lacked a unified, data-driven view of product performance, regional demand, and channel effectiveness — limiting strategic planning and growth initiatives.

Tableau Business Intelligence KPI Reporting Retail Analytics
Learn More
Aurora Threads Boutique Retail Insights

Aurora Threads Boutique - Power BI Retail Insights

2025

Used DAX and M language in Power BI calculations, to uncover insights into sales performance, customer behavior, and product trends, to help the boutique make timely and well-informed business decisions.

Power BI DAX Retail Analytics
Learn More

Technical Skills

Core competencies in business intelligence and data analysis

�<️

SQL

Expert Level

Power BI

Expert Level

Excel

Expert Level

📉

Tableau

Advanced Level

Technologies & Tools

PostgreSQL Power BI DAX Excel VBA Python Pandas Tableau Looker Studio Git BigQuery Jupyter Statistical Analysis

Excel Projects

Advanced Excel analysis and dashboard projects

Krown Caterings Dashboard

Krown Caterings Sales Performance Dashboard

2024

Challenge: Catering company lacked visibility into menu performance and seasonal demand patterns.
Solution: Built Excel dashboard with pivot tables tracking revenue by menu item, event type, and season.
Insights: Corporate events generated 65% of revenue; summer months showed 40% higher demand.
Impact: Optimized menu offerings and staffing, increasing profitability by 22%.

Excel Pivot Tables KPI Reporting
Learn More
Cafe Harmony Dashboard

Cafe Harmony Performance Dashboard

2024

Challenge: Cafe needed to understand peak hours, product mix, and customer preferences.
Solution: Created Excel dashboard analyzing hourly sales, product categories, and customer traffic patterns.
Insights: Morning rush (7-9am) drove 45% of daily revenue; beverages had 70% profit margin.
Impact: Adjusted staffing schedules and inventory, reducing waste by 30% and improving service speed.

Excel Pivot Tables Operations Analytics
Learn More
Sales Dashboard

Regional Sales Performance Tracker

2023

Challenge: Sales managers lacked real-time visibility into team performance across 5 regions.
Solution: Built interactive Excel dashboard with pivot tables tracking quotas, conversion rates, and revenue by rep.
Insights: North region underperformed by 23%; top performers had 45% higher follow-up rates.
Impact: Enabled data-driven coaching that improved regional performance by 17% in Q2.

Excel Pivot Tables Dashboard
Learn More

Power BI Dashboards

Interactive business intelligence dashboards driving strategic decisions

Deskify Dashboard

Deskify Office Supplies Performance Report

2025

Challenge: Office supply company struggled with fragmented data sources and manual reporting processes.
Analysis: Built interactive Power BI dashboard centralizing sales, inventory, and customer data with automated refresh.
Insights: Identified top-performing product categories, seasonal trends, and customer segments driving 70% of revenue.
Impact: Reduced reporting time by 80%, improved data accuracy, and enabled real-time decision-making for inventory and pricing.

Power BI Business Intelligence KPI Reporting
Learn More
Aurora Threads Boutique

Aurora Threads Boutique - Power BI Retail Insights

2025

Used DAX and M language in Power BI calculations to uncover insights into sales performance, customer behavior, and product trends, helping the boutique make timely and well-informed business decisions.

Power BI DAX Retail Analytics
Learn More

Python Projects

Data analysis and machine learning projects using Python

Python projects with full case studies coming soon!

SQL Projects

Advanced SQL analysis and data transformation projects

Employee Success Analytics

Employee Success Analytics — Workforce & Retention Insights (NextGen Corp)

2024

NextGen Corp is a growing technology company focused on building high-performing teams while maintaining strong employee satisfaction and retention. Leadership wanted data-driven insights into workforce performance, turnover patterns, and compensation fairness to support strategic HR decisions.

PostgreSQL SQL Excel KPI Reporting
Learn More
Bank Fraud Detection

Bank Fraud Detection & Prevention

2025

Challenge: PioneerTrust Bank needed to identify fraudulent transaction patterns and high-risk accounts.
Analysis: Used SQL to detect high-value anomalies, repeat offenders, and geographic inconsistencies in transactions.
Insights: Identified customers with multiple flagged transactions; withdrawals had highest fraud risk; detected same-day multi-location activity.
Impact: Enabled faster fraud identification, prioritized high-risk investigations, and strengthened monitoring controls.

PostgreSQL Fraud Analytics Risk Detection
Learn More
Hospital Data Model

RiverSide General Hospital Data Model

2024

Challenge: Hospital needed organized data structure for patient records, appointments, and billing analysis.
Solution: Designed efficient relational data model using Draw.io with proper entity relationships and normalization.
Insights: Created scalable schema supporting patient care tracking, appointment scheduling, and financial reporting.
Impact: Enabled streamlined data analysis and improved reporting accuracy for hospital operations.

Data Modeling Healthcare Database Design
Learn More

Showing all SQL projects

Tableau Dashboards

Interactive visualizations and business intelligence dashboards

Choco de Luxe Performance Analytics

Choco de Luxe European Sales Performance & Market Expansion Analysis

2024

Challenge: Premium chocolate brand lacked unified view of product performance, regional demand, and channel effectiveness.
Analysis: Built Tableau dashboard analyzing sales across European cities, product categories, and sales channels.
Insights: Gift boxes and dark chocolate drove highest margins; December and February showed peak demand; online channels delivered highest ROI.
Impact: Enabled data-driven decisions on pricing, marketing, and expansion strategy across Europe.

Tableau Business Intelligence KPI Reporting Retail Analytics
Learn More

Showing all Tableau projects

""

Let's Work Together

Ready to unlock insights from your data and drive business growth? Let's discuss how I can help optimize your operations and profitability.

Send Message